Gclust databases
Databases of homolog tables
of many organisms, automatically constructed but from a biologist's
viewpoint.
Developed by Naoki Sato
This page just describes the Gclust software and Gclust
databases.
Use Gclust server to see
how phylogenetic profiling with pre-calculated clusters is useful in
gene finding.
A document in Japanese is also available as a
PDF file. Click here to download.
Brief summary of the
Gclust software
Gclust software was developed to make clusters of protein sequences
from all predicted protein sequences in a selected set of genomes. The
clusters are homolog groups, but not ortholog clusters (see below for
the distinction), and therefore, contain all homologous sequences
encoded by the selected genomes. An ortholog cluster, such as the one
in KEGG Orthologs or COG in NCBI, contains only a single sequence for
each genome, and such a single representative is usually selected by a
criterion called "bi-directional best hit". By contrast, a homolog
group contains all reliable homologs, that represents a gene family.
However, we need several techniques (see the next section for
specialists) to obtain good homolog groups, because a very large group
of sequences consisting of unrelated sequences could be formed if
similar sequences are simply added to a homolog group. Gclust uses
E-value of BLASTP and overlap score (representing the proportion of
homologous regions shared by two sequences) as a two-dimensional
matrix, to select for the proper E-value and overlap score for each
homolog group so that not too many homologs are put into the group. To
do so, number of organisms is also considered. Detailed explanation of
the algorithm was presented in the GIW2005 paper.
Gclust databases
The Gclust software can be used with any set of genomes. We have been
working on photosynthetic organisms, and are interested in finding
conserved proteins in prokaryotic and eukaryotic photosynthetic
organisms. Therefore, initial datasets included mainly photosynthetic
organisms with some non-photosynthetic organisms for comparison. The
datasets, CZ16Y, CZ20x, CZ30 and CZ35, are such datasets including
different number of genomes. The results of computation are now
available for the public through a web interface. The dataset Bact129
includes 132 species of bacteria. The dataset ALL145 includes animals
and plants (including algae) as well as many bacteria and Archaea.
Organellar genomes are also included, but selection is only possible on
organisms (nuclear genome and mitochondrial genome, as well as
chloroplast genome, if present). For organellar studies, datasets
including all available chloroplast genomes (plus cyanobacterial
genomes) or many mitochondrial genomes of photosynthetic organisms are
also provided in this web site. They are named CPBACT8x and Mt23,
respectively.
Uniqueness of the Gclust software
Many researchers use BLASTP to search homologous sequences in the
non-redundant databases. But the results are usually difficult to
interpret, because many similar sequences rank high. There are
sometimes duplicated entries of an identical sequence. The Gclust
databases are pre-calculated similarity matrices, which show all
homologs in the selected dataset. Users do not need to perform an
iterated BLASTP search.
If you are not satisfied with the provided
clusters, ...
it is time to make clusters by yourself. Use the Gclust software to
make clusters from a genome set containing your favorite organisms.
Currently, detailed usage of the Gclust software as well as its
associated software is being prepared.
Use of the Gclust software (for computational
biologists)
The Gclust software is written in C, and runs on any common UNIX
platforms including Mac OS X.
Memory requirement depends on input data and mode of operation. When
all the 102,513 predicted proteins encoded in the four eukaryotic
(including organelles) and 13 prokaryotic genomes are clustered, about
9 GB memory was used on SGI Onyx3400. The computation of the ALL145
dataset required more than 2 weeks using the supercomputer system in
the Human Genome Center at the University of Tokyo.
The input file is a summary list
generated by a perl script, bl2ls3.pl, from
the output of all-against-all BLASTP analysis
over the entire protein sequences. Very large proteins are excluded
from the analysis, because they cause unusual clustering of unrelated
proteins.
In the current version of Gclust, the BLASTP results as parsed as
described above, are processed in the following two steps: first, the
data are read and partially transformed in internal data format. In the
save mode, these data are saved
in a large file 'data.out' for
further analysis with varying parameters. A 'tapering' or 'ashikiri' option is
provided to remove low homology data, with keeping low homology data
for short sequences (from 1e-6 for >100 aa to 1e-3 for <40 aa)..
In Gclust, homology data are handled as a chunk called sqlist, holding region to region
similarity, namely, coordinates of similarity region in both (query and
target) proteins and E-value. Therefore, a combination of two proteins
may have many sqlist data, depending on the domain structure and
repeat.
In the second step, Gclust reads the data.out file, and
performs
clustering according to various options. However, the most useful
option is the -clique
option, which produces a good clustering result in relatively short
time (within one day). In the clique mode, the sqlist data are
converted to match data,
which hold data of binary (i.e., protein to protein) similarity,
namely, best E-value among
sqlist, overlap score showing
total overlap region devided by total length, and domain structure estimated from
homology segments. Normally, clique mode requires org_list data, listing organisms.
For each protein, all match data are tabulated in 2D, using E-value and
overlap score. Match data are selected one by one starting from the
corner with the highest E-value and highest overlap score. Various
criteria are applied, but essentially, a clearly defined cluster of
match data with respect to E-value and overlap score is selected. In
addition, match data are
selected to cover as many organisms as possible but without picking up
very low similarity data. After such purification of match data, idlist holding list of IDs of
homologs is made for each proein. The threshold E-value and overlap
score are also stored. Then, homolog clusters are formed by merging
individual idlists. At this
stage, idlists with very diffent threshold E-values are not merged.
After a repeat of merging and removing, isolated proteins generated by
removal step are again incorporated into the most adequate cluster.
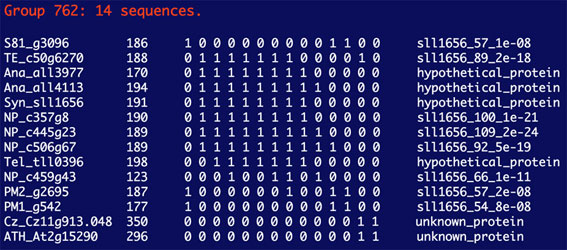
Homolog groups are sorted according to the number of entries. Finally,
homolog groups are printed out to a large file as a canetated
similarity matrix. The matrix may be expressed in 1 (similar) - 0
(dissimilar), E-value, or overlap score, depending on output options,
1, r, or s, respectively.
Using a perl script homologtableG4.pl,
the homology matrix can be transformed into a table showing members of
each homolog group.
Then, tbsort2 software (written in C) is used to select homolog groups
that are conserved in a selected set of organisms. We call this
"phylogenetic profiling", which may be useful to extract conserved
proteins of unknown function, which might be involved in the pathway or
process that are shared by the set of organisms. We apply this
principle to extract "chloroplast proteins of endosymbiont origin" or
CPRENDOs. But other usage of the phylogenetic profiling might be
possible.
-- additional old explanation --
In the basic mode with the -hom
option, single-linkage clustering is performed with an E-valueas a threshold. In this case, all
the homologues that are linked by a single homology relationship are
placed in a single cluster. Such clusters are used as discrete
characters to make a parsimony tree (using the PAUP software) that we
call 'genome tree'. With -repeat option, an iterated clustering
is performed by changing the threshold E-value from the lowest (such as
10-50) to the highest (such as 10-3). During the
iteration, an abrupt increase in the number of members of a cluster is
taken as a sign of
formation of unnatural cluster including distantly related or
multidomain
proteins.
An additional criterion is the overlap score,
which is defined as the sum of length of homology regions over the
entire sequences divided by the sum of the lengths of the two sequences
to be
compared.
Another criterion is the complexity of domain
structure,
which is estimated based on the BLASTP data and which is used to
eliminate
multidomain proteins during the initial iteration. By these criteria,
concise
or natural clusters are extracted and removed from further clustering
with
higher E-values. In an additional mode with -homsub
option, the final clusters are further sub-clustered to maximize
similarity within each subgroup.
Example homolog group
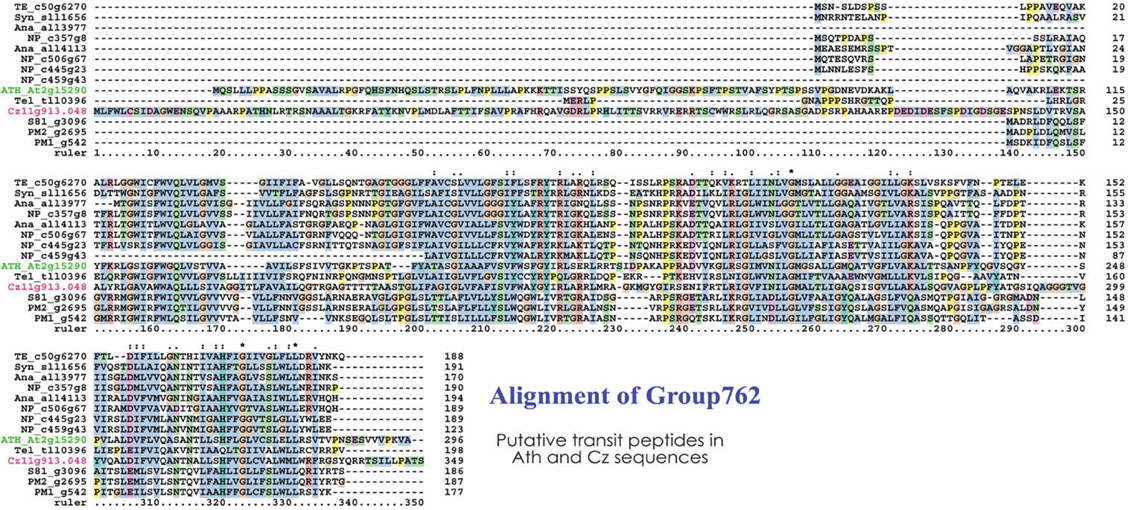
Example alignment
References
N. Sato, M. Ishikawa, M. Fujiwara and K. Sonoike (2005)
Mass identification of chloroplast proteins of endosymbiont origin by
phylogenetic profiling based on organism-optimized homologous protein
groups.
Genome Informatics 16: 56-68.
N. Sato (2003)
Gclust: genome-wide clustering of protein sequences for identification
of photosynthesis-related genes resulting from massive horizontal gene
transfer.
Genome Informatics 14: 585-586.
N. Sato (2002)
Comparative analysis of the genomes of cyanobacteria and plants.
Genome Informatics 13: 173-182.
Distribution of data and software
is now possible from the gclust server.
Last update: June 15, 2006.
Back
to Sato Laboratory Home Page